
Written by: Shawni Marich, Novella Realty
May 1st, 2020
The COVID-19 pandemic is certainly having an impact on the market, both for sellers and buyers.
Included here are the market statistics for residential housing during April 2020 compared to April 2019 in Ashtabula County.
Month/YTD Comparison for New Properties for Sale
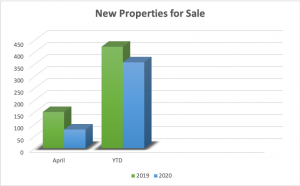
| April 2019 | April 2020 | YTD 2019 | YTD 2020 | |
| # of Properties | 151 | 78 | 423 |
358
|
April 2019 vs. April 2020: The # of New Properties For Sale decreased by 73, which represents a decrease of 48.3%
YTD 2019 vs. YTD 2020: the # of New Properties For Sale decreased by 65, which represents a decrease of 15.4%
Comparison for April 2019 – April 2020 Months Supply of Inventory
The number of new properties for sale in April this year saw a sharp decrease from the same month last year of 48.3%. Many people are holding their homes off the market due to safety concerns and economic uncertainty.
With so many people taking a “wait-and-see” approach, the market truly lacks inventory right now. With many buyers looking who still NEEDS to move, there is a lack of selection.
Our months of inventory are another key indicator of the current market condition. In the chart below, note that the months of inventory for April 2020 decreased significantly compared to April of last year. 4.2 months of inventory means that hypothetically if no other homes were listed on the market and sales continued at the same rate, it would take 4.2 months to sell everything that is currently listed.
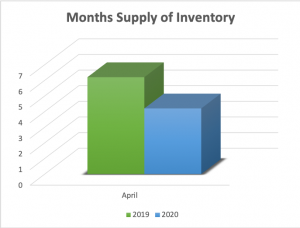
| April 2019 | April 2020 | |
| # Properties | 6.2 | 4.2 |
April 2019 – April 2020: The # Months Supply of Inventory decreased by 2.0, which represents a decrease of 32.3%
Month/YTD Comparison for Properties That Went Under Contract
Meanwhile, despite inventory being down, the number of properties that have gone under contract has slightly increased in April of 2020 as compared to April 2019. Overall year to date this year to last, 8% more properties have gone under contract.
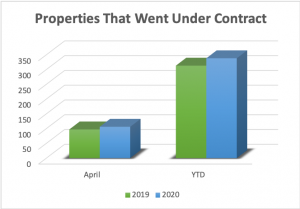
| April 2019 | April 2020 | YTD 2019 | YTD 2020 | |
| # Properties | 97 | 106 | 313 |
338
|
April 2019 vs. April 2020: The # Properties That Went Under Contract increased by 9, which represents an increase of 9.3%
YTD 2019 – YTD 2020: The # Properties That Went Under Contract increased by 25, which represents an increase of 8.0%
Month/YTD Comparison for Median Sold Price
Supply and demand help to determine the price. With lack of supply but still a good deal of demand on the market, the median sold price increased in April in Ashtabula County and is higher on average for the year too. Keep in mind that many of the homes that sold in April may have been under contract just at the start of the pandemic since it can take 30-60 days to close.
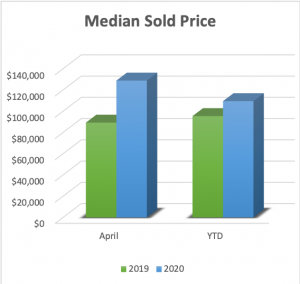
| April 2019 | April 2020 | YTD 2019 | YTD 2020 | |
| Median Price | $89,250 | $128,800 | $95,400 |
$109,450
|
|
# Properties |
90 | 69 | 260 | 254 |
April 2019 – April 2020: There was a dollar increase of $39,550, which represents an increase of 44.3%
YTD 2019 – YTD 2020: There was a dollar increase of $14,050, which represents an increase of 14.7%
Month/YTD Comparison for Average Days on Market
Average Days on Market saw an increase in April this year compared to last. This could be partly because new listings are down, so buyers are viewing properties that have been on the market longer and now pursuing them.
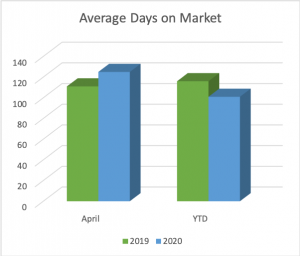
| April 2019 | April 2020 | YTD 2019 | YTD 2020 | |
| # Days | 111 | 125 | 116 |
101
|
April 2019 – April 2020: The # Average Days on Market increase by 14, which represents an increase of 12.6%
YTD 2019 – YTD 2020: The # Average Days on Market decreased by 15, which represents a decrease of 12.9%
There are many new considerations to make right now, whether listing or purchasing. It’s important to have a professional on your side who is knowledgeable about what is happening and who can offer specific advice based on your current needs.
My brokerage has additional resources available and we are constantly adding new information to our website and Facebook pages to keep you informed.
Website: www.novellarealty.com
Facebook: www.facebook.com/novellarealty/
If you are thinking about listing your home or are simply curious to know what it is currently worth, request a free detailed analysis of your home here!
If you have to buy or sell right now, keep in mind you may want to work with an agent who is Move Safe™ Certified. Here’s what that means:
Shawni is Move Safe™Certified


Shawni uses the following tools, technology, and practices that help keep you safe during COVID-19:
- Meets with clients virtually
- Strengthens the digital presence of listed home through photography, dedicated websites, video tours, 3D tours, aerial photography, floorplans, and virtual staging
- Has implemented safety measures for showings including ensuring the house is clean for showing, arriving before the client to open all doors and windows, adhering to social distancing protocol, and limiting showings to vetted buyers.
- Uses an e-sign platform for disclosures, offers and counteroffers, and closings
- Includes a COVID-19 addendum in the purchase agreement
This article is written by Shawni Marich, Broker of Novella Realty in Jefferson, OH.

Statistical information was pulled using yes-MLS and © 2012-2013 Terradatum and its suppliers and licensors | Terradatum P.O. Box 387 Glen Ellen CA 95442 USA | PATENT PENDING