
Now that the economy starts to recover from the Coronavirus Pandemic we will see how the market will continue to be affected.
Included here are the market statistics for residential housing during June 2020 compared to June 2019 in Ashtabula County.
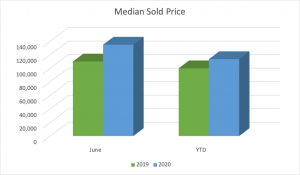
Month/YTD Comparison for Median Sold Price
Supply and demand help to determine the price. With a lack of supply but still a good deal of demand on the market, the median sold price increased in June in Ashtabula County and is higher on average for the year too. Median sold price in June 202o increased by $24,850, equal to 22.6%, compared to June 2019 median sold prices. In comparison, the YTD sold prices there was an increase of $13,500, representing a 13.5% increase. Despite the impact of the Coronavirus Pandemic, sold prices remain strong and are continuing to increase.
| JUNE 2019 | JUNE 2020 | YTD 2019 | YTD 2020 | |
| MEDIAN PRICE | $110,000 | $134,850 | $100,000 | $113,500 |
| # OF PROPERTIES | 82 | 110 | 439 | 437 |
June 2019 – June 2020: There was a dollar increase of $24,850, which represents an increase of 22.6%
YTD 2019 – YTD 2020: There was a dollar increase of $13,500, which represents an increase of 13.5%
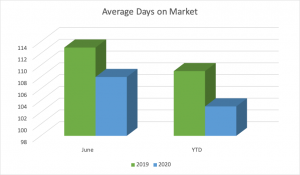
Month/YTD Comparison for Average Days on Market
Average Days on Market saw a decrease in June this year compared to last year. This could be because there are fewer properties are being listed, so buyers are viewing properties and pursing them faster than they would have before the pandemic.
| JUNE 2019 | JUNE 2020 | YTD 2019 | YTD 2020 | |
| # OF DAYS | 113 | 108 | 109 | 103 |
June 2019 – June 2020: The # Average Days on Market decreased by 5, which represents a decrease of 4.4%
YTD 2019 – YTD 2020: The # Average Days on Market decreased by 6, which represents a decrease of 5.5%
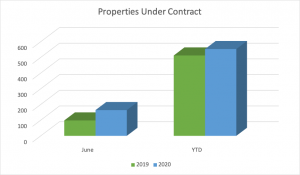
Month/YTD Comparison for Properties That Went Under Contract and New Properties for Sale
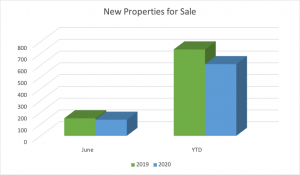
New properties for sale for June of this year compared to the last decreased by 12, equal to 8.1%. The YTD decreased by 125, or 17%! This means there is less inventory for the month of June.
| JUNE 2019 | JUNE 2020 | YTD 2019 | YTD 2020 | |
| # OF PROPERTIES | 98 | 167 | 512 | 553 |
June 2019 – June 2020: The # Properties That Went Under Contract increased by 66, which represents an increase of 67.3%
YTD 2019 – YTD 2020: The # of Properties That Went Under Contract increased by 41, which represents an increase of 8.0%
Properties that went under contract for the month of June, we saw an increase of 67.3% from last year, for the properties going under contract – for the year we are up 8% from last. Although new listings for the month of June is down 8% from last year, properties going under contract is up 67% from last June. This is due to a lack of inventory. People do not want to wait and are possibly reacting faster.
| JUNE 2019 | JUNE 2020 | YTD 2019 | YTD 2020 | |
| # OF PROPERTIES | 149 | 137 | 734 | 609 |
June 2019 – June 2020: The # New Properties for Sale decreased by 12, which represents a decrease of 8.1%
YTD 2019 – YTD 2020: The # New Properties for Sale decreased by 125, which represents a decrease of 17.0%
Comparison for June 2019 – June 2020 Months Supply of Inventory
The number of new properties for sale in June saw a drastic decrease from the same month last year of 54.3%. Many people are still holding their homes off the market due to safety concerns and economic uncertainty.
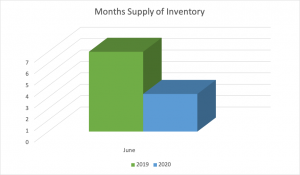
| JUNE 2019 | JUNE 2020 | |
| # OF MONTHS | 7 | 3.3 |
June 2019 – June 2020: The # Months Supply of Inventory decreased by 3.7, which represents a decrease of 52.9%
Month/YTD Comparison for Closed Sales
The market is stable compared to last year with an increase in sale for the month of June, that puts the month increase by 34%, despite the YTD being decreased by .5%, which shows despite the Coronavirus the market is thriving. It’s a seller’s market right now. This is due to inventory being down and sales continuing to increase.
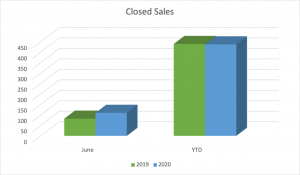
| JUNE 2019 | JUNE 2020 | YTD 2019 | YTD 2020 | |
| # OF PROPERTIES | 82 | 110 | 439 | 437 |
June 2019 – June 2020: The # Closed Sales increased by 28, which represents an increase of 34.1%
YTD 2019 – YTD 2020: The # Closed Sales decreased by 2, which represents a decrease of 0.5%
There are many considerations to make right now, whether listing or purchasing. It’s important to have a professional on your side who is knowledgeable about what is happening and who can offer specific advice based on your current needs.
My brokerage has additional resources available and we are constantly adding new information to our website and Facebook pages to keep you informed.
Website: https://novellarealty.com
Facebook: www.facebook.com/novellarealty/
If you are thinking about listing your home or are simply curious to know what it is currently worth, request a free detailed analysis of your home here!
If you have to buy or sell right now, keep in mind you may want to work with an agent who is Move Safe™ Certified. Here’s what that means:
Shawni is Move Safe™Certified


Shawni uses the following tools, technology, and practices that help keep you safe during COVID-19:
- Meets with clients virtually
- Strengthens the digital presence of listed home through photography, dedicated websites, video tours, 3D tours, aerial photography, floorplans, and virtual staging
- Has implemented safety measures for showings including ensuring the house is clean for showing, arriving before the client to open all doors and windows, adhering to social distancing protocol, and limiting showings to vetted buyers.
- Uses an e-sign platform for disclosures, offers and counteroffers, and closings
- Includes a COVID-19 addendum in the purchase agreement
This article is written by Shawni Marich, Broker of Novella Realty in Jefferson, OH.

Statistical information was pulled using yes-MLS and © 2012-2013 Terradatum and its suppliers and licensors | Terradatum P.O. Box 387 Glen Ellen CA 95442 USA | PATENT PENDING